The previously transformed apple bin images were now fed into a machine learning based object detection algorithm to fit masks and bounding boxes around individual apples within the image. Next, a statistical approach was used to estimate the apple size analytics of a full apple bin based off positive detections seen in output image 1.
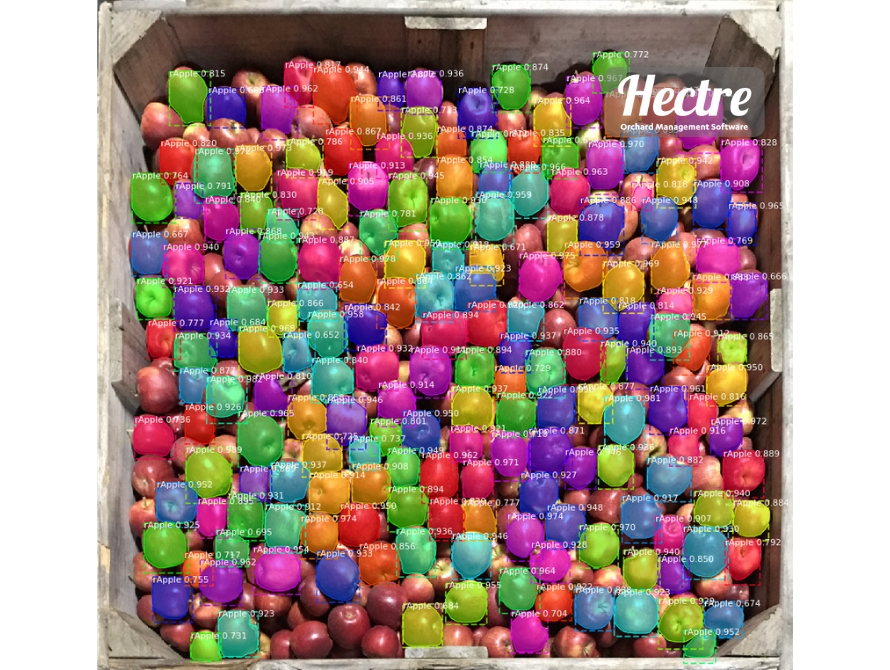
(Output 1) – Transformed full apple bin image with apple detection visualisation
The statistical approach for the apple size estimation
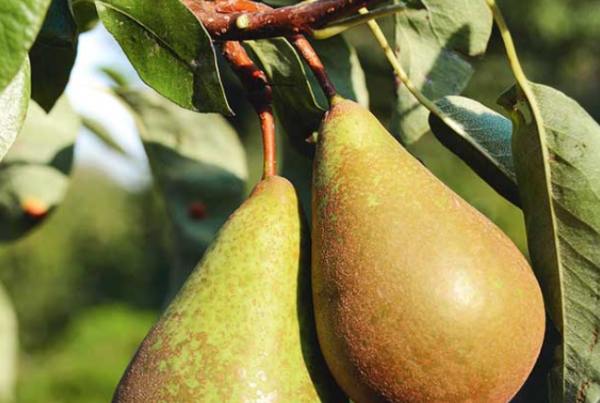
A major assumption made for the case of apples was that all of the fruit was round. This applied as a general case where an apples top to bottom height and side to side width ratio was close to equal when compared to less round fruits like pears or avocadoes.
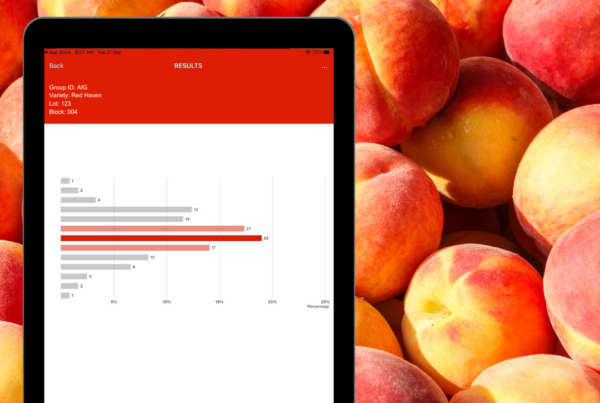
For all positively detected apples within a processed image, a list of bounding box widths was generated. A histogram was produced from the bounding box width data to present how many fruits of each size category were detected. Figure 1 showed the data based off output image 1, which represents a normal distribution.
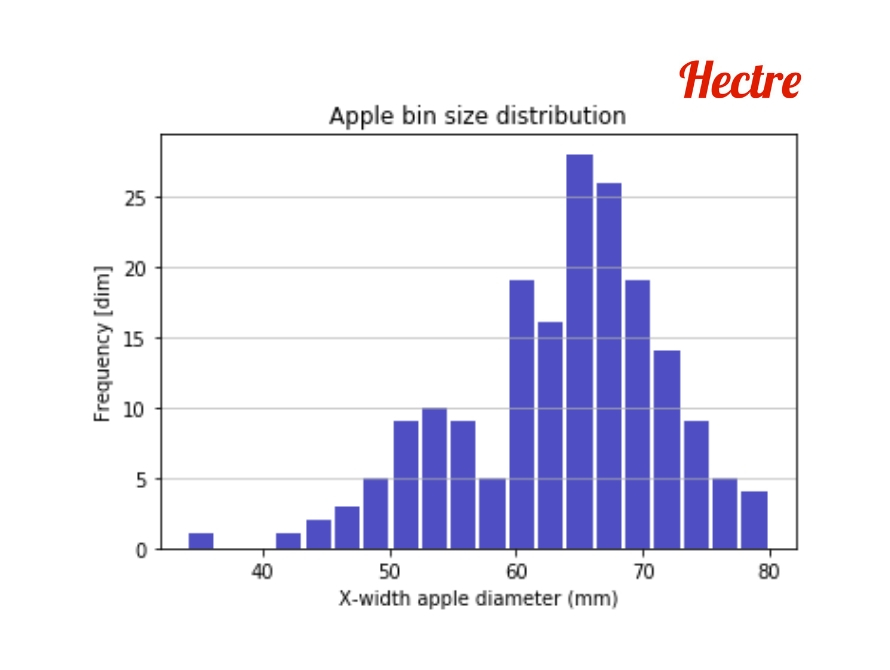
(Figure 1) Histogram representing the various apple sizes present on the top layer of the full apple bin
The two most useful points of information for apple growers based off the histogram data included mean size and standard deviation. The mean was the average apple size while the standard deviation gave an indication as to how much variation in apple size existed throughout the top layer.
The maximum and minimum apple sizes detected were also recoverable and may be of use to growers. Where the maximum represented the largest and minimum represented the smallest apple on the top layer of the bin. These two quantities were useful, however only described a single apple each as opposed to describing a general case for the entire top layer.
Size data as soon as apples are harvested
Spectre could now estimate the size for the entire bin by taking the detected fruit on the top layer of the processed full apple bin with accuracy. This was done by considering the visible top layer of the bin as a sample of the entire bin. 185 positive detections were made for the example in output image 1. Assuming 3000 apples present within the apple bin, 185 positive detections accounted for 6.2% of the entire bin.
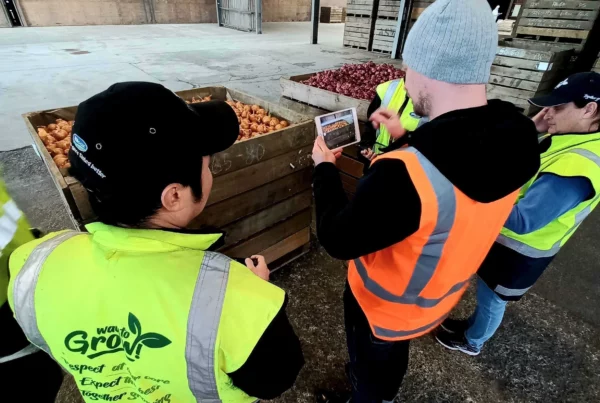
The proposed scheme showed how apple bin size estimations could be made at the time of harvest by accurately detecting a sample with speed and next to no infrastructure or hardware – just by taking a photo on a mobile phone.
Now that the groundwork is done, we are working on the accuracy of Spectre’s estimation power. We will report on the progress here with more to follow!